Economic Data: Getting Cooler
Despite the recent heat wave roiling the U.S., this month also brought data supporting the Fed’s soft landing narrative. May’s CPI was cooler than expected, with core CPI at its lowest since August 2021. Likewise, pending home sales were at their slowest pace since 2001. The May Core PCE reading of 2.6% over the past twelve months met expectations. Economists broadly expect price pressures to continue to fall in the latter half of 2024, with further consumer goods discounting in June and ongoing disinflation in services. Alas, the data was not ice cold: May nonfarm payrolls and average hourly wage data exceeded expectations, which bolsters the Fed’s case for sticking with the higher-for-longer stance.
Given the disinflation trend, cooling labor markets, and weaker economic data, markets are now pricing in a 67% chance of a September rate cut, up from 45% at the beginning of the month. The June FOMC meeting concluded with projections indicating just one rate cut this year, down from three projected in March.
Investing at the Top: Should you wait for a pullback?
One of the most common challenges for investors is timing. Behavioral finance research suggests that we often fall prey to a phenomenon known as “Anchoring”, where we consciously or unconsciously use a fixed reference point (the “anchor”) as the context for determining relative value. This can be helpful in short term decisions, such as determining which cuts of steak are on sale when shopping for a holiday barbecue. However, this bias is less helpful for long-term investing as it often leads to investors sitting on the sideline while waiting for the “right” time to commit.
Many investors look at the current price of an index, like the S&P 500, and see reports of all-time highs as a reason to wait. However, research indicates that investing at all-time highs is a reasonable strategy. Market highs tend to occur in clusters and strong performance runs are often followed by further highs.
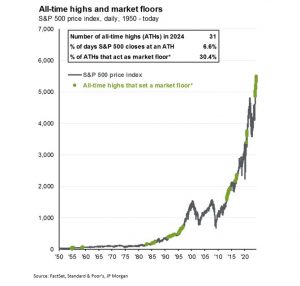
Since the start of the year, there have been a whopping 31 new all-time highs in the S&P 500. As one will note looking at the chart below, historically 30% of the time these all-time high moments created a new “floor” (highlighted in green) which the market subsequently didn’t fall below. Indeed, research done by JP Morgan indicates that investors who bought at S&P 500 peaks since 1950 did better in the 1-, 2-, 3-, and 5-year periods that followed compared investors who bought at the average price during each of those periods.

Investors waiting for an ideal moment often miss out on the opportunity to participate in rising markets. Missing even a small number of days in any given market cycle tends to result in lower returns compared to those who remain fully invested. As we have noted previously, missing the 30 best days in the S&P 500 over the last 30 years would have resulted in less than half the return of those who were fully invested over the entire time period.
Investors with a long time horizon should heed the adage “Time in the market is more important than timing the market”.
Capital Markets
In June, enthusiasm for AI was evident as Nvidia surpassed Microsoft mid-month to become the world’s most valuable company. However, Nvidia’s shares subsequently dropped over 15% due to concerns about extended valuations, an overcrowded trade, and a concentrated revenue base. Meanwhile, Apple’s shares rose nearly 10% after announcing several AI integrations into its platforms, including a partnership with OpenAI to incorporate ChatGPT into Siri and other applications.
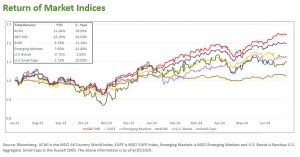
Equity returns were mixed in June. The All-Country World Index (ACWI) rose 2.3% and the S&P 500 rose 3.6%, while the EAFE and U.S. small caps fell -1.6% and -0.9%, respectively. There continues to be a wide dispersion both in valuation and performance between the large and small cap stocks. Emerging markets rebounded upward nearly 4% after falling last month on slower growth expectations in China.


