“The secret to happiness is having low expectations.” – Warren Buffett
We have written numerous times in the last six months about the disconnect between investor expectations of Fed rate cuts and the Fed’s own projections. In Q4 2023 when the Fed made clear they were holding off on further rate hikes and were expecting two cuts in 2024, investor expectations were for at least four. Earlier this year, when the Fed adjusted their projections to three possible cuts, investor expectations climbed further to a starry-eyed seven cuts.
February and March saw a reversal of these overly optimistic hopes, which was a welcome change.
Fed Chair Powell finally brought the message home to investors with an appearance on 60 Minutes in February, echoing the same talking points he and the Fed governors have shared for months. Two economic reports in February supported the Fed’s decision to delay: a hot January CPI report and higher than expected forecasted growth in nonfarm payrolls. In January, a steeper than expected decline in retail sales suggested that the Fed’s approach is working, albeit slowly. Last week, the San Francisco Fed updated the central bank’s favorite inflation gauge, the Personal Consumption Expenditures price index (PCE). The index rose 2.5% last month on an annual basis, still well above the Fed’s 2% target. Powell noted that this was “pretty much in line with our expectations” and cautioned investors again that the Fed is not in a rush to cut rates: “If we reduce rates too soon, there’s a chance that inflation would pop back and we’d have to come back in and that would be very disruptive.”
The message seems to be getting through. Investor expectations for the first rate cut shifted from March to June. In addition, the number of cuts expected is now in line with the Fed’s projections.
This removes a potential distraction for investors, who should accept two undeniable truths:
- Forecasting the time it will take to curb inflation is an exercise in futility.
- Progress will be made at a sluggish pace.
While we cannot predict when the Fed will cut rates, we can look at how the market has reacted after past rate hike cycles ended.
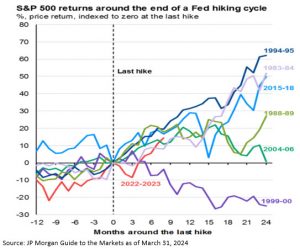
The chart below shows S&P 500 returns for the 12 months before and 24 months after the end of a rate hike cycle. The 12-month periods leading up to a final hike tend to have negative returns, while the periods following the final hike tend to fare much better. Our current hiking cycle is marked in red, and the hope is that we continue to see a return pattern similar to the 1994-95, 1983-84, and 1988-89 cycles.
Most importantly, historically, for long-term investors: S&P 500 returns for periods 3+ years following a final hike were healthy, with only the 1999-2000 hiking cycle showing negative returns 3 years out.

Capital Markets
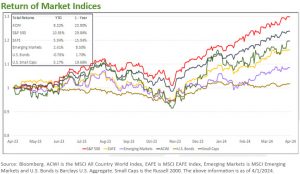
In March, most major equity indices finished higher. The All-Country World Index (ACWI) was up +3.4%, the S&P 500 rose +3.4%, the EAFE gained +3.5% and Emerging market equities rose +2.5%. U.S. Small caps had another strong month, finishing up +4.2%. Bonds rose slightly by 0.76%. Treasuries were virtually unchanged for the month, with the 2-year yield at 4.6% and the 10-year yield at 4.2%.


